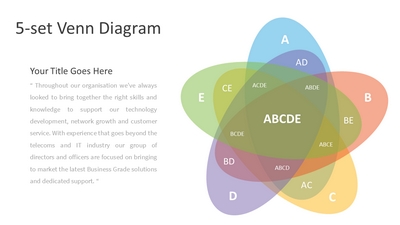
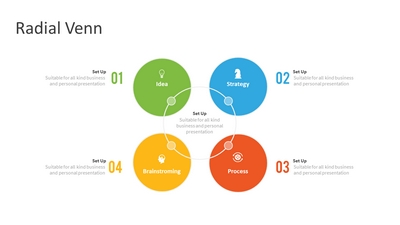
Charts
Our graph templates are effective for visualizing large sets of data in a slide or presentation. Charts and graphs are great for displaying facts and statistics in your presentation for business or marketing purposes.Most of these graph templates help convey this information in a lot simplified manner to understand and communicate it effectively. Our uniquely designed ppt templates include chart designs like waterfall chart PowerPoint, bubble chart PowerPoint, comparison chart, pie chart, and graph designs like a bar graph, bell curve, Gaussian curve, etc., and many more. The graphs PowerPoint templates can be used by business professionals, marketers, and analysts for showing data and numbers in an engaging manner.Connected with dashboards more visually pleasing in the presentations. Use our presentation templates free of cost to create winning presentations.